
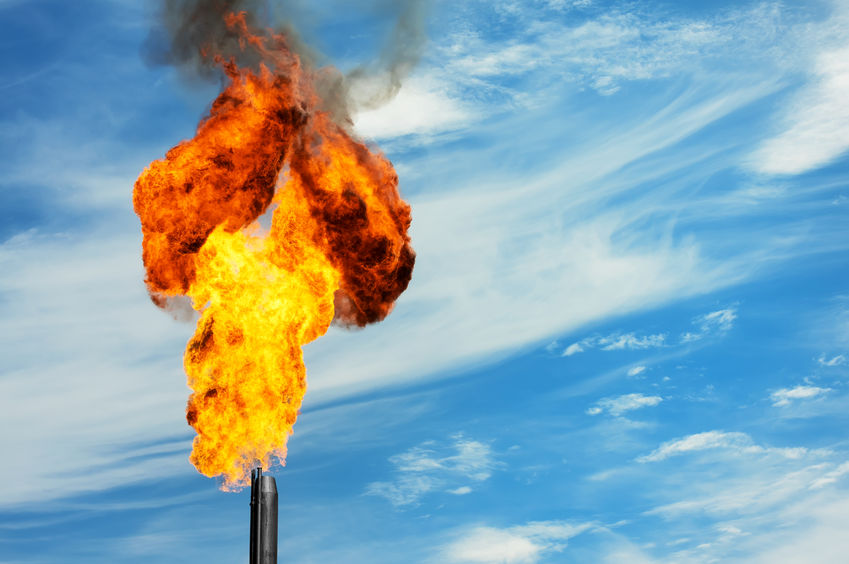
Gas flare penalties collected by the Nigerian Upstream Petroleum Regulatory Commission (NUPRC) rose by 56 per cent to N611.42 billion in 2025, as oil and gas companies flared 215.09 billion cubic feet (bcf) of gas during the year.
The figures are contained in the commission’s 2025 Annual Report.
The report showed that gas flare penalties rose from N391.26 billion in 2024 to N611.42 billion in 2025. In 2023, the commission collected N140.54 billion under the same revenue head.
The penalties accounted for about 5.87 per cent of the N10.42 trillion the commission generated in 2025. Total revenue fell by 20.53 per cent compared with 2024.
Flare rate rises
According to the report, Nigeria produced 2.73 trillion cubic feet (tcf) of associated and non-associated gas in 2025, averaging 7.47 bcf per day. Of this, 2.507 tcf, or 92 per cent, was utilised, while 0.215 tcf, or 7.89 per cent, was flared. A further 0.10 per cent was reported as shrinkage.
The commission said the flare rate rose by 0.28 percentage points from the 7.61 per cent recorded in 2024. It described the change as a “marginal increase” in flaring over the previous year.
The commission blamed the increase on new entrants into the industry. It said the “slight uptick” could be attributed to higher associated gas (AG) production, “especially from new entrants whose AG handling facilities are yet to be on board.”
The report said the monthly flare rate was highest in December at 9.25 per cent. The commission said this was due to problems with gas re-injection compressors on board the Agbami FPSO after turnaround maintenance. September recorded the second-highest rate at 9.12 per cent, while May had the lowest at 7.16 per cent.
Who flared most
By contract type, Joint Venture companies accounted for 51.61 per cent of the gas flared, or about 111 bcf. Sole Risk companies followed with 28.46 per cent, Production Sharing Contract companies with 13.58 per cent and ex-marginal field operators with 6.35 per cent.
NNPC E&P Limited flared the most gas among individual companies, at about 56.94 bcf, followed by SEPNU with about 32.92 bcf. Renaissance, Chevron’s joint venture and Antan Producing were also among the major contributors.
The report showed that some small operators flared nearly all the gas they produced. Multisub, Ingentia, Anatolia and General Hydrocarbon were each recorded as flaring 100 per cent.
The commission said only 24 of the 59 companies directed to submit Flare Elimination and Monetisation Plans had complied. This left 35 companies, or 59 per cent, in default.
It said a Final Compliance Notice had been issued to the defaulting firms. The commission warned that continued failure may attract “administrative penalties, suspension of flare permits, or other enforcement actions” under the Petroleum Industry Act (PIA) and related regulations.
The report also showed that 12 flare points are yet to have flare meters installed. It added that only 18 of the 51 operators have sales gas meters installed.
In 2025, the commission received and processed 109 applications for non-routine gas flaring permits from 19 operating companies. The applications covered emergencies, maintenance, well activities and pre-commissioning or start-up operations.
Domestic gas delivery
On domestic supply, the commission said it allocated 2,892 million standard cubic feet per day (MMscf/d) to producing leases for the Domestic Gas Delivery Obligation, against a demand requirement of 3,046 MMscf/d. Operators delivered an average of 2,230 MMscf/d, or about 77 per cent of the allocation.
The commission listed inadequate gas infrastructure, grid constraints and pipeline vandalism among the challenges affecting delivery.
Notes before filing
Headline grammar: I changed “Penalties Rises” to “Penalties Rise”.
Cause of the penalty rise: The report does not say why penalties rose. The “new entrants” explanation relates to the flare rate only, so the story keeps the two separate.
Flare meters: I left out the report’s 73 per cent compliance figure. The report says 122 meters are installed on 128 flare points, which does not match 73 per cent or the 12 points without meters.
Calculated figures: The 56 per cent rise and the 5.87 per cent revenue share are calculated from the report’s tables. The share matches the report’s pie chart.
Company flare volumes: These are taken from the Table 16 scan, which is hard to read. Confirm them against the original document before naming companies.
I can also cut this to a shorter print version or write a separate sidebar on the 35 defaulting companies if you want.
We’ve got the edge. Get real-time reports, breaking scoops, and exclusive angles delivered straight to your phone. Don’t settle for stale news. Join LEADERSHIP NEWS on WhatsApp for 24/7 updates →
Join Our WhatsApp Channel